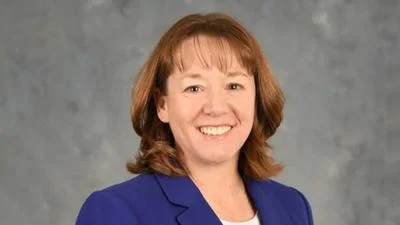
Dave Deets, Superintendent at Mascoutah Community Unit School District 19 | Mascoutah Community Unit School District 19
Dave Deets, Superintendent at Mascoutah Community Unit School District 19 | Mascoutah Community Unit School District 19
Data showed that Hispanic students made up 5.3% of the 37,909 students in the county. They were the fourth most represented ethnicity.
Among the 27 districts in St. Clair County, Mascoutah Community Unit School District 19 recorded the highest enrollment of Hispanic students in the 2023-24 school year, with a total of 434 students.
The main offices of all districts mentioned in the story are located in cities associated with St. Clair County.
Illinois allocated $8.6 billion to K-12 education in its 2025 budget—a $350 million increase over FY 2024, meeting the minimum required under the state’s school funding formula.
As of the 2023-24 school year, Illinois public schools enrolled approximately 1.85 million students across nearly 4,000 schools. There was roughly one teacher for every 15 students, slightly better than the national average of 1:16.
| District | Hispanic Student Enrollment Percentage | Total enrollment |
|---|---|---|
| Mascoutah Community Unit School District 19 | 10.4% | 4,177 |
| Belleville Township High School District 201 | 5.1% | 4,676 |
| O'Fallon Community Consolidated School District 90 | 5.5% | 3,952 |
| Belleville School District 118 | 6.3% | 3,303 |
| O'Fallon Township High School District 203 | 8.1% | 2,510 |
| East St. Louis School District 189 | 2.1% | 4,536 |
| Pontiac-William Holliday School District 105 | 12.9% | 607 |
| Central School District 104 | 10.9% | 622 |
| Cahokia Community Unit School District 187 | 2.2% | 3,021 |
| Whiteside School District 115 | 5% | 1,158 |
| Wolf Branch School District 113 | 6% | 779 |
| Dupo Community Unit School District 196 | 4.8% | 881 |
| Lebanon Community Unit School District 9 | 7.8% | 514 |
| Belle Valley School District 119 | 4% | 961 |
| Harmony Emge School District 175 | 4.4% | 677 |
| Grant Community Consolidated School District 110 | 4.9% | 568 |
| High Mount School District 116 | 8.4% | 320 |
| Shiloh Village School District 85 | 4.6% | 545 |
| Freeburg Community Consolidated School District 70 | 2.6% | 780 |
| Millstadt Consolidated Community School District 160 | 2.8% | 684 |
| Marissa Community Unit School District 40 | 3.7% | 487 |
| Freeburg Community High School District 77 | 2% | 661 |
| Signal Hill School District 181 | 3.6% | 280 |
ORGANIZATIONS IN THIS STORY
!RECEIVE ALERTS
DONATE


 Alerts Sign-up